Manufactured Home Producer Price Index June 2026 - Wholesale Pricing Trends
Rob Ripperda
Manufactured Home (PPI)
The Producer Price Index (PPI) for manufactured housing rose 0.4% in June from the previous month.
The PPI is a national index for producer pricing and is currently up 3.7% above the June of 2025 value.
Wholesale prices continued to rise to their highest level since June of 2022 and now sit near the all-time peak set in July of that year.
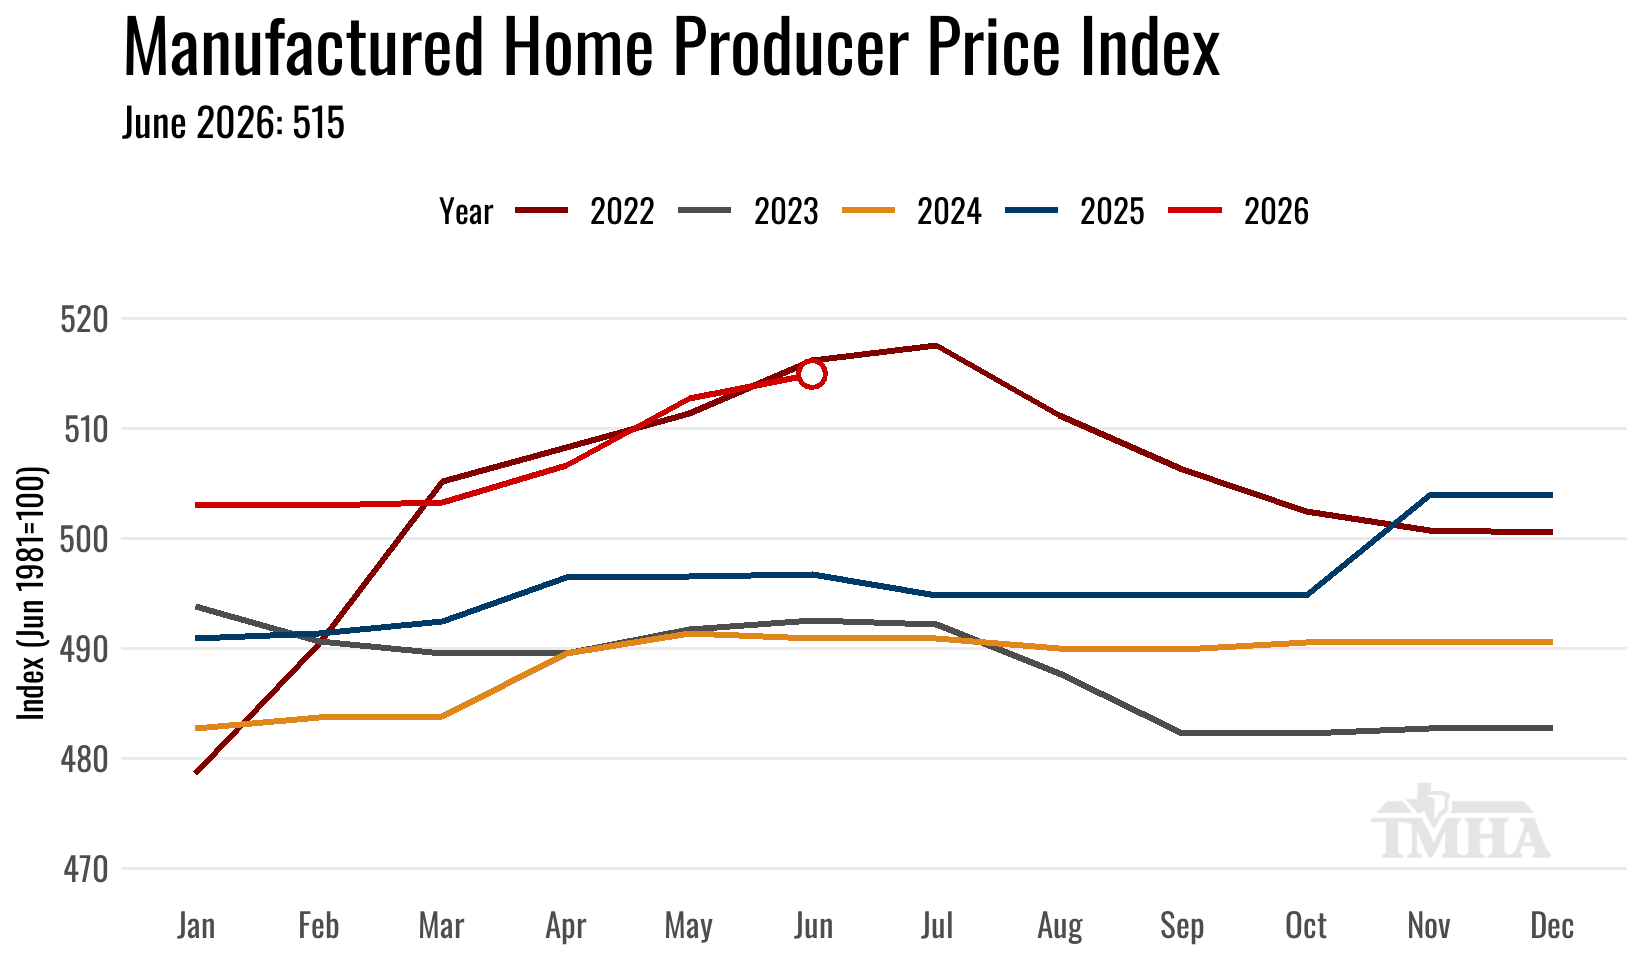
This chart is built from the U.S. Bureau of Labor Statistics Producer Price Index by Industry: Manufactured home, mobile home, manufacturing, not seasonally adjusted (PCU321991321991)
Inputs to Residential Construction Goods (PPI)
On the costs of materials to manufacturers the PPI for input goods to residential construction fell 0.8% in June from the previous month. The year-over-year change for June was 6.9% above 2025.
Building materials came off of last month’s all-time high, but are still very elevated from the 2022-2025 levels.
The Inputs to Residential Construction Goods PPI is not a perfect proxy for manufactured home builders materials costs as it includes ready-mix concrete prices and does not include the steel used for chassis assembly, nor does it weigh transportation costs as heavily as they would be in a manufactured home index, but it does tend to move directionally in line with what Texas manufactured housing builders report on their costs of materials in the Texas Manufactured Housing Survey.
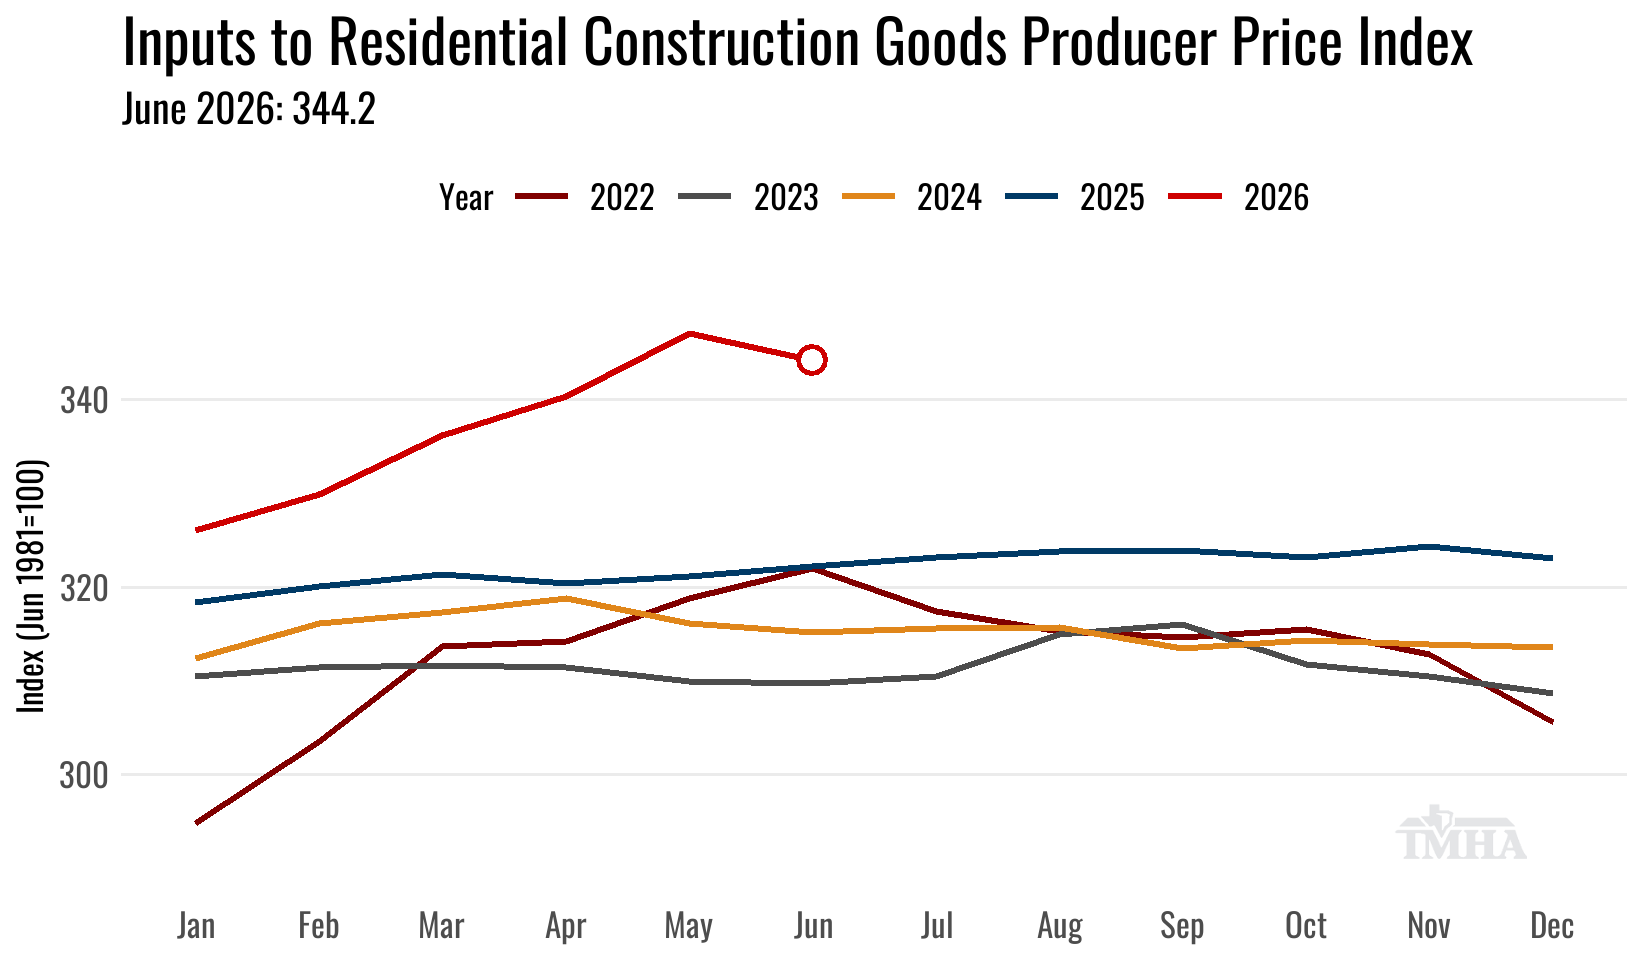
This chart is built from the U.S. Bureau of Labor Statistics Producer Price Index by Commodity: Inputs to residential construction, goods, not seasonally adjusted (WPUIP2311001)
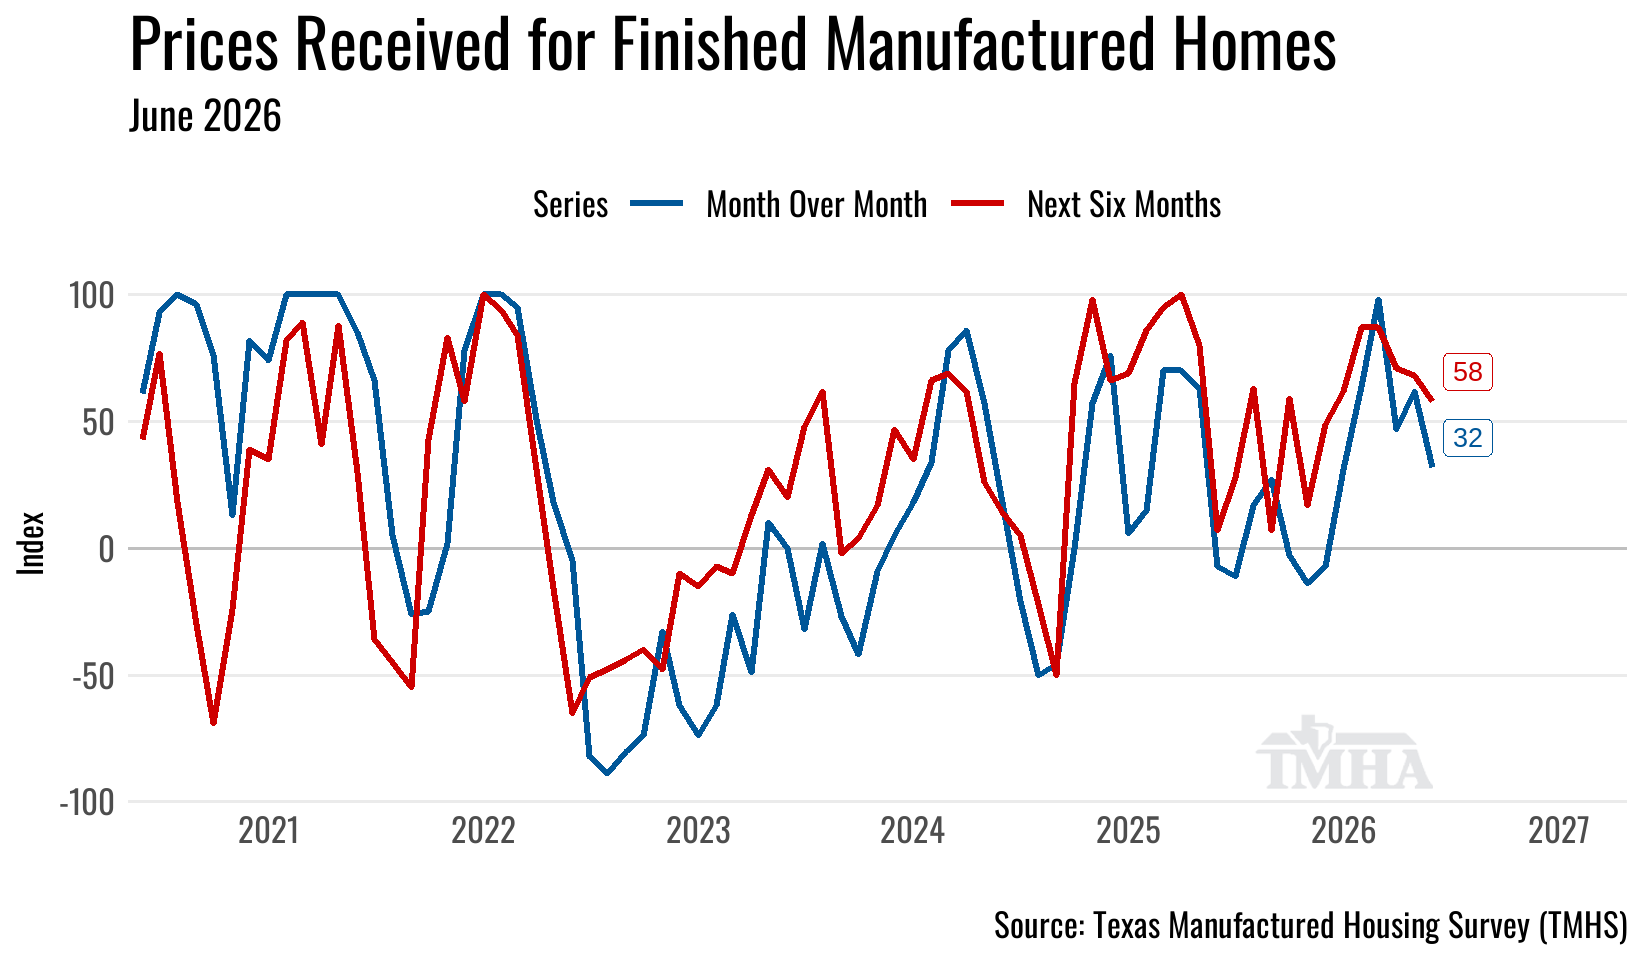
Prices Received for Finished Manufactured Homes (TMHS)
The regional Texas Manufactured Housing Survey (TMHS) results had prices received for finished homes still rising in June, though across fewer respondents than in May, with the index easing to 32 from May’s reading of 62.
TMHA members can view all of the indices on the TMHS report page.
Average Retail Selling Prices with TMHA Forecasts (MHS)
Using the MH PPI in a regression model to predict average selling prices in the South Census region puts the average sales price in June 2026 at $161,300 (+/- $9,300) for multi-section homes and $88,200 (+/- $6,300) for single-section homes*.
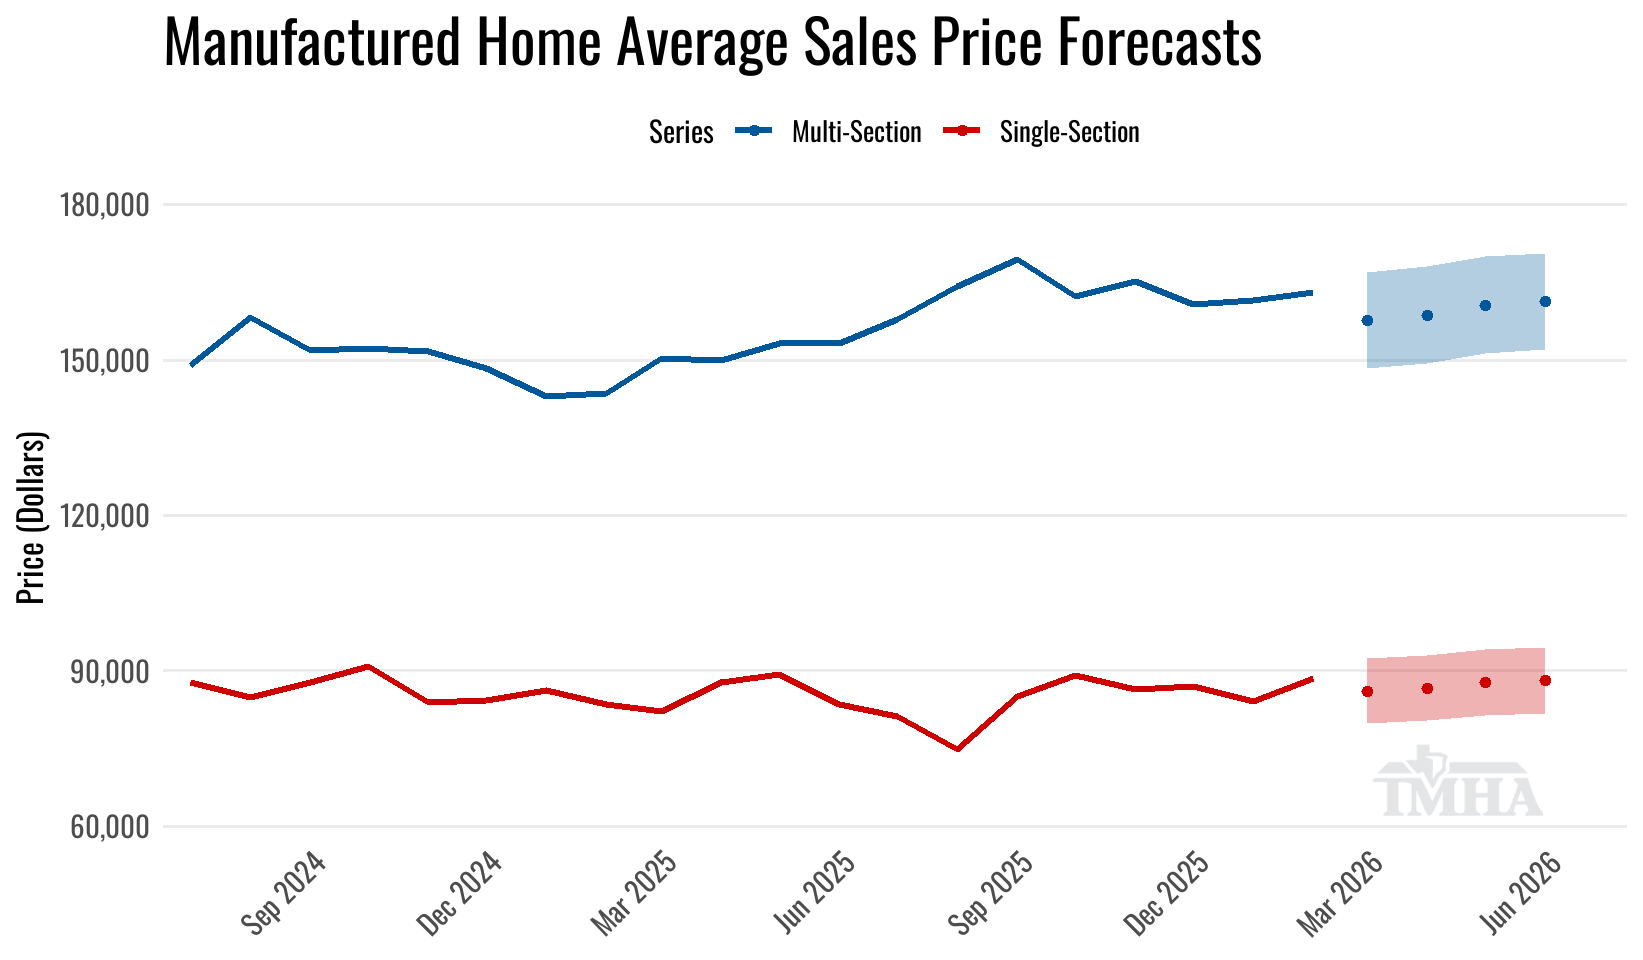
*The PPI is not a perfect predictor for the Census’ Manufactured Housing Survey average price results, but it does account for over 90% of the variability when used in a regression model as the explanatory variable.